HadCM2 GCM Model Information
Background Information
The experiments performed at the Hadley Centre used the Unified Model (Cullen, 1993). These experiments represented a large step forward in the way that climate change was modelled by GCMs and raised new possibilities for scenario construction. This experiment overcame some of the major difficulties that were associated with the previous generations of equilibrium (circa IPCC 1990) and cold-start transient (circa IPCC 1992) climate change experiments.
HadCM2 has a spatial resolution of 2.5° x 3.75° (latitude by longitude) and the representation produces a grid box resolution of 96 x 73 grid cells. This produces a surface spatial resolution of about 417km x 278 km reducing to 295 x 278km at 45 degrees North and South (comparable to a spectral resolution of T42).
The equilibrium climate sensitivity (DT2x) of HadCM2, that is the global-mean temperature response to a doubling of effective CO2 concentration, is approximately 2.5°C, although, this quantity varies with the time-scale considered. This is somewhat lower than most other GCMs (IPCC, 1992).
In order to undertake a 'warm-start' experiment it is necessary to perturb the model with a forcing from an early historical era, when the radiative forcing was relatively small compared to the present. The Hadley Centre started their experiments performed with HadCM2 with forcing from the middle industrial era, about 1860 (Mitchell et al., 1995; Johns et al., 1995).
The greenhouse gas only integrations, HadCM2GG, used the combined forcing of all the greenhouse gases as an equivalent CO2 concentration. A further series of integrations, HadCM2GS, used the combined equivalent CO2 concentration plus the negative forcing from sulphate aerosols. The HadCM2GG integrations simulated the change in forcing of the climate system by greenhouse gases since the early industrial period (taken by HadCM2 to be 1860). The addition of the negative forcing effects of sulphate aerosols represents the direct radiative forcing due to anthropogenic sulphate aerosols by means of an increase in clear-sky surface albedo proportional to the local sulphate loading (refer to Mitchell et al., 1995 for details of this method). The indirect effects of aerosols were not simulated.
The modelled control climate shows a negligible long term trend in surface air temperature over the first 400 years. The trend is about +0.04°C per century, which is comparable to other such experiments. HadCM2CON represents an improvement over previous generations of GCMs that have been used at the Hadley Centre (Johns et al., 1995; and Airey et al.,1995).
The experiments performed have simulated the observed climate system using estimated forcing perturbations since 1860. Johns et al., (1995) and Mitchell et al., (1995) have established that HadCM2's sensitivity is consistent with the real climate system. The agreement between the observed global-mean temperature record and that produced in these experiments is better for HadCM2GS than for HadCM2GG. This implies that HadCM2Gs has captured the observed signal of global-mean temperature changes better than HadCM2GG for the recent 100-year record.
HadCM2 Integrations
The following gives a list of the climate change integrations that have been performed using HadCM2:
- HadCM2GGa1, to 4: an ensemble of Greenhouse Gas Integrations
(historic equivalent GG 1860 - 1989, 1% compound increase GG
1990 - 2099).
The different members of the ensembles are:
HadCM2GGa1 Greenhouse gas 1% forcing Member1 (the original HadCM2GG);
HadCM2GGa2 Greenhouse gas 1% forcing Member2;
HadCM2GGa3 Greenhouse gas 1% forcing Member3;
HadCM2GGa4 Greenhouse gas 1% forcing Member4. - HadCM2GGd1 to 4, an ensemble of Greenhouse Gas Integrations
(historic equivalent GG 1860 - 1989, 0.5% compound increase GG
1990 - 2099).
The different members of the ensembles are:
HadCM2GGd1 Greenhouse gas 0.5% forcing Member1;
HadCM2GGd2 Greenhouse gas 0.5% forcing Member2;
HadCM2GGd3 Greenhouse gas 0.5% forcing Member3;
HadCM2GGd4 Greenhouse gas 0.5% forcing Member4. - HadCM2GSa1 to 4: an ensemble of Greenhouse Gas plus Sulphate
Aerosol Integrations (GGa forcing plus historic SO4
1860 - 1989, IS92a SO4 1990 - 2099).
The different members of the ensembles are:
HadCM2GSa1 Greenhouse and Sulphate 1% forcing Member1 (the original HadCM2GS);
HadCM2GSa2 Greenhouse and Sulphate 1% forcing Member2;
HadCM2GSa3 Greenhouse and Sulphate 1% forcing Member3;
HadCM2GSa4 Greenhouse and Sulphate 1% forcing Member4. - HadCM2GSd1 to 4: an ensemble of Greenhouse Gas plus Sulphate
Aerosol Integrations (GGd forcing plus historic SO4
1860 - 1989, IS92d SO4 1990 - 2099).
The different members of the ensembles are:
HadCM2GSd1 Greenhouse and Sulphate 0.5% forcing Member1;
HadCM2GSd2 Greenhouse and Sulphate 0.5% forcing Member2;
HadCM2GSd3 Greenhouse and Sulphate 0.5% forcing Member3;
HadCM2GSd4 Greenhouse and Sulphate 0.5% forcing Member4.
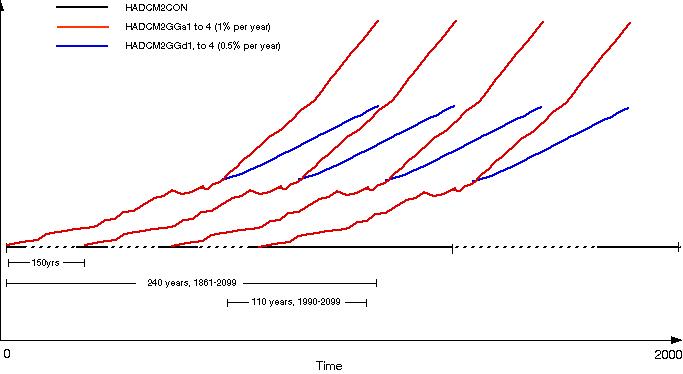
Conceptual structure of the experimental design of the HadCM2 ensembles experiments
Global-Mean Temperature, Precipitation and CO2 Changes (w.r.t. 1961 - 1990) for the HadCM2 integrations
| 2020s | 2050s | 2080s | ||||||||||
| DT
(°C) |
DP (%) |
DSL (cm) |
CO2
(ppmv) * |
DT (°C) |
DP (%) |
DSL
(cm) |
CO2
(ppmv) * |
DT
(°C) |
DP
(%) |
DSL
(cm) |
CO2
(ppmv) * |
|
| GGa1 |
1.21 |
2.2 |
12.4 |
447 |
2.10 |
3.5 |
24.8 |
554 |
3.17 |
5.18 |
41.1 |
697 |
| GGa2 |
1.20 |
2.1 |
12.6 |
447 |
2.02 |
3.3 |
24.6 |
554 |
3.03 |
4.77 |
40.6 |
697 |
| GGa3 |
1.16 |
1.9 |
13.0 |
447 |
2.06 |
3.4 |
25.5 |
554 |
3.07 |
4.80 |
41.6 |
697 |
| GGa4 |
1.20 |
2.0 |
12.7 |
447 |
2.03 |
3.2 |
25.3 |
554 |
3.01 |
4.74 |
41.4 |
697 |
| GGaX |
1.19 |
2.0 |
12.7 |
447 |
2.05 |
3.3 |
25.0 |
554 |
3.01 |
4.87 |
41.1 |
697 |
| GSa1 |
0.94 |
1.4 |
8.2 |
447 |
1.58 |
2.2 |
16.9 |
554 |
2.58 |
3.87 |
29.5 |
697 |
| GSa2 |
0.93 |
1.5 |
8.2 |
447 |
1.54 |
2.2 |
17.1 |
554 |
2.47 |
3.70 |
30.1 |
697 |
| GSa3 |
0.94 |
1.4 |
8.3 |
447 |
1.61 |
2.4 |
17.3 |
554 |
2.49 |
3.64 |
29.7 |
697 |
| GSa4 |
0.91 |
1.3 |
8.4 |
447 |
1.50 |
2.1 |
17.3 |
554 |
2.51 |
3.71 |
30.1 |
697 |
| GSaX |
0.92 |
1.4 |
8.3 |
447 |
1.56 |
2.2 |
17.1 |
554 |
2.51 |
3.73 |
29.9 |
697 |
| GGd1 |
0.98 |
1.8 |
11.5 |
398 |
1.53 |
2.8 |
21.5 |
443 |
1.95 |
3.53 |
33.0 |
498 |
| GGd2 |
0.84 |
1.5 |
9.5 |
398 |
1.38 |
2.4 |
18.9 |
443 |
1.92 |
3.36 |
29.8 |
498 |
| GGd3 |
0.88 |
1.6 |
7.6 |
398 |
1.43 |
2.6 |
17.7 |
443 |
1.97 |
3.45 |
29.2 |
498 |
| GGd4 |
0.98 |
1.7 |
6.2 |
398 |
1.50 |
2.7 |
15.8 |
443 |
1.94 |
3.48 |
27.0 |
498 |
| GGdX |
0.92 |
1.7 |
6.7 |
398 |
1.46 |
2.6 |
18.5 |
443 |
1.94 |
3.46 |
29.7 |
498 |
| GSd1 |
0.74 |
1.0 |
7.9 |
398 |
1.40 |
2.5 |
15.8 |
443 |
1.84 |
3.23 |
25.4 |
498 |
| GSd2 |
0.76 |
1.3 |
8.9 |
398 |
1.29 |
2.4 |
16.6 |
443 |
1.77 |
3.16 |
25.7 |
498 |
| GSd3 |
0.84 |
1.4 |
9.5 |
398 |
1.34 |
2.3 |
17.3 |
443 |
1.81 |
3.17 |
26.6 |
498 |
| GSd4 |
0.81 |
1.3 |
9.5 |
398 |
1.37 |
2.4 |
17.6 |
443 |
1.87 |
3.37 |
27.2 |
498 |
| GSdX |
0.79 |
1.3 |
8.9 |
398 |
1.35 |
2.4 |
16.8 |
443 |
1.82 |
3.23 |
26.2 |
498 |